

5 Stocks to Watch For An Oversold Bounce Next Week
I don’t love snapback trades. They’re the closest I ever get to trying to catch a falling knife—and that’s rarely a winning proposition. I much prefer buying stocks breaking out of solid bases. But markets don’t always give you that environment.
If you’re going to take a snapback trade—something oversold and ready to reverse at a key technical level or indicator—there’s no better place to look than the 200-day moving average.
[Note: I use the 200-day exponential moving average or EMA).
The 200EMA matters because institutions care about it. Above it, they tend to accumulate. Below it, they tend to distribute.
The problem is that even at the 200EMA, a stock can keep falling just as easily as it can bounce.
That being said, the more aggressive the selling before hitting the 200EMA and the more extended the price is below the indicator, the more likely a serious counter trend bounce is to happen.
There are two ways I try to trade this.
The first is to enter off an intraday base and/or reversal.
The second is waiting for a daily reversal bar—ideally a hammer.
The downside of waiting for the daily hammer is that if it’s real, you often get a gap up the next morning. That means worse entry, more risk, and less reward.
If I had to choose, I’d rather try to catch the intraday reversal.
Then, if the stock is finishing the day strong, I can sell a piece into the close to give myself a cushion—and then see if I get follow-through the next day.
If it fails intraday, I’m out for a small loss, with no overnight risk.
For more on how to identify and catch intraday turns, check out these two videos from my “Deconstructing a Trade” series”
Taking A Surgical Long Trade On A Big Down Day
Using Intraday Moving Averages To Put The Odds In Your Favor
With that in mind, here are five candidates this week for an oversold reversal trade.
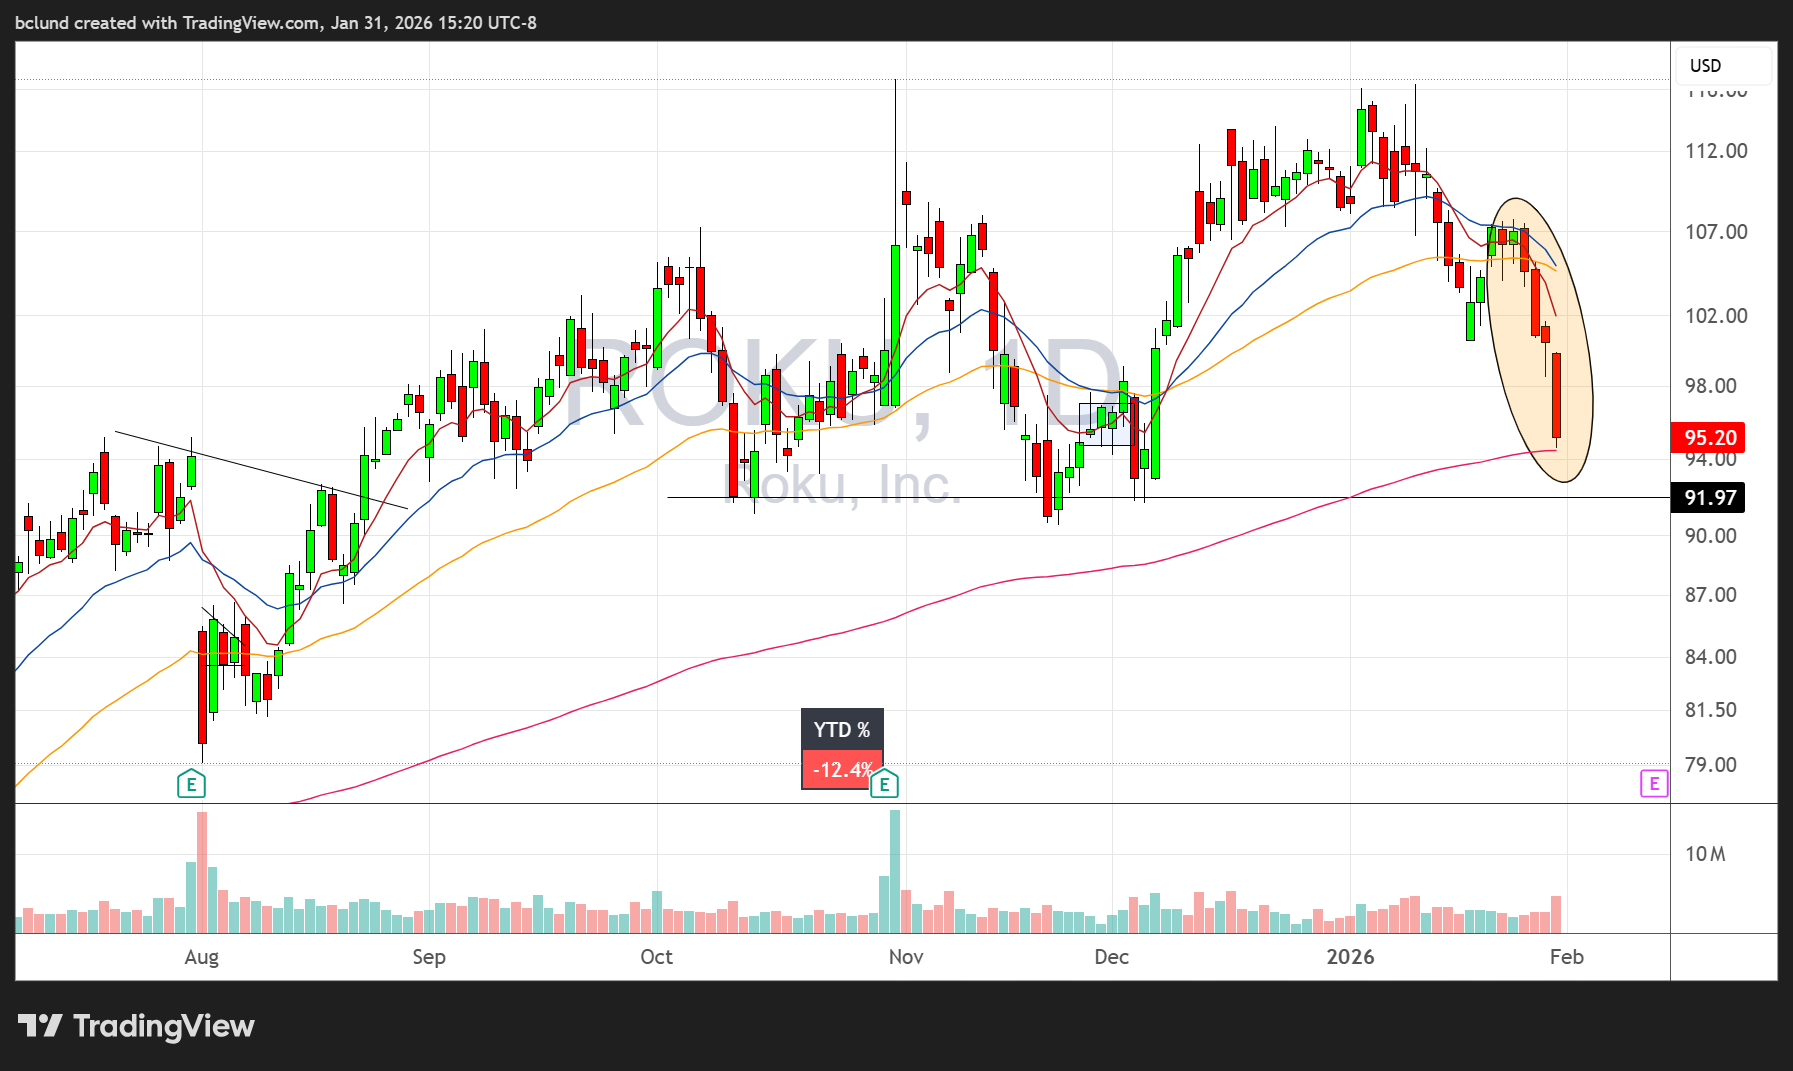
ROKU 0.00%↑ has dropped four days straight, losing 11% in the process, and is now sitting just above the 200EMA—where we could see a bounce.
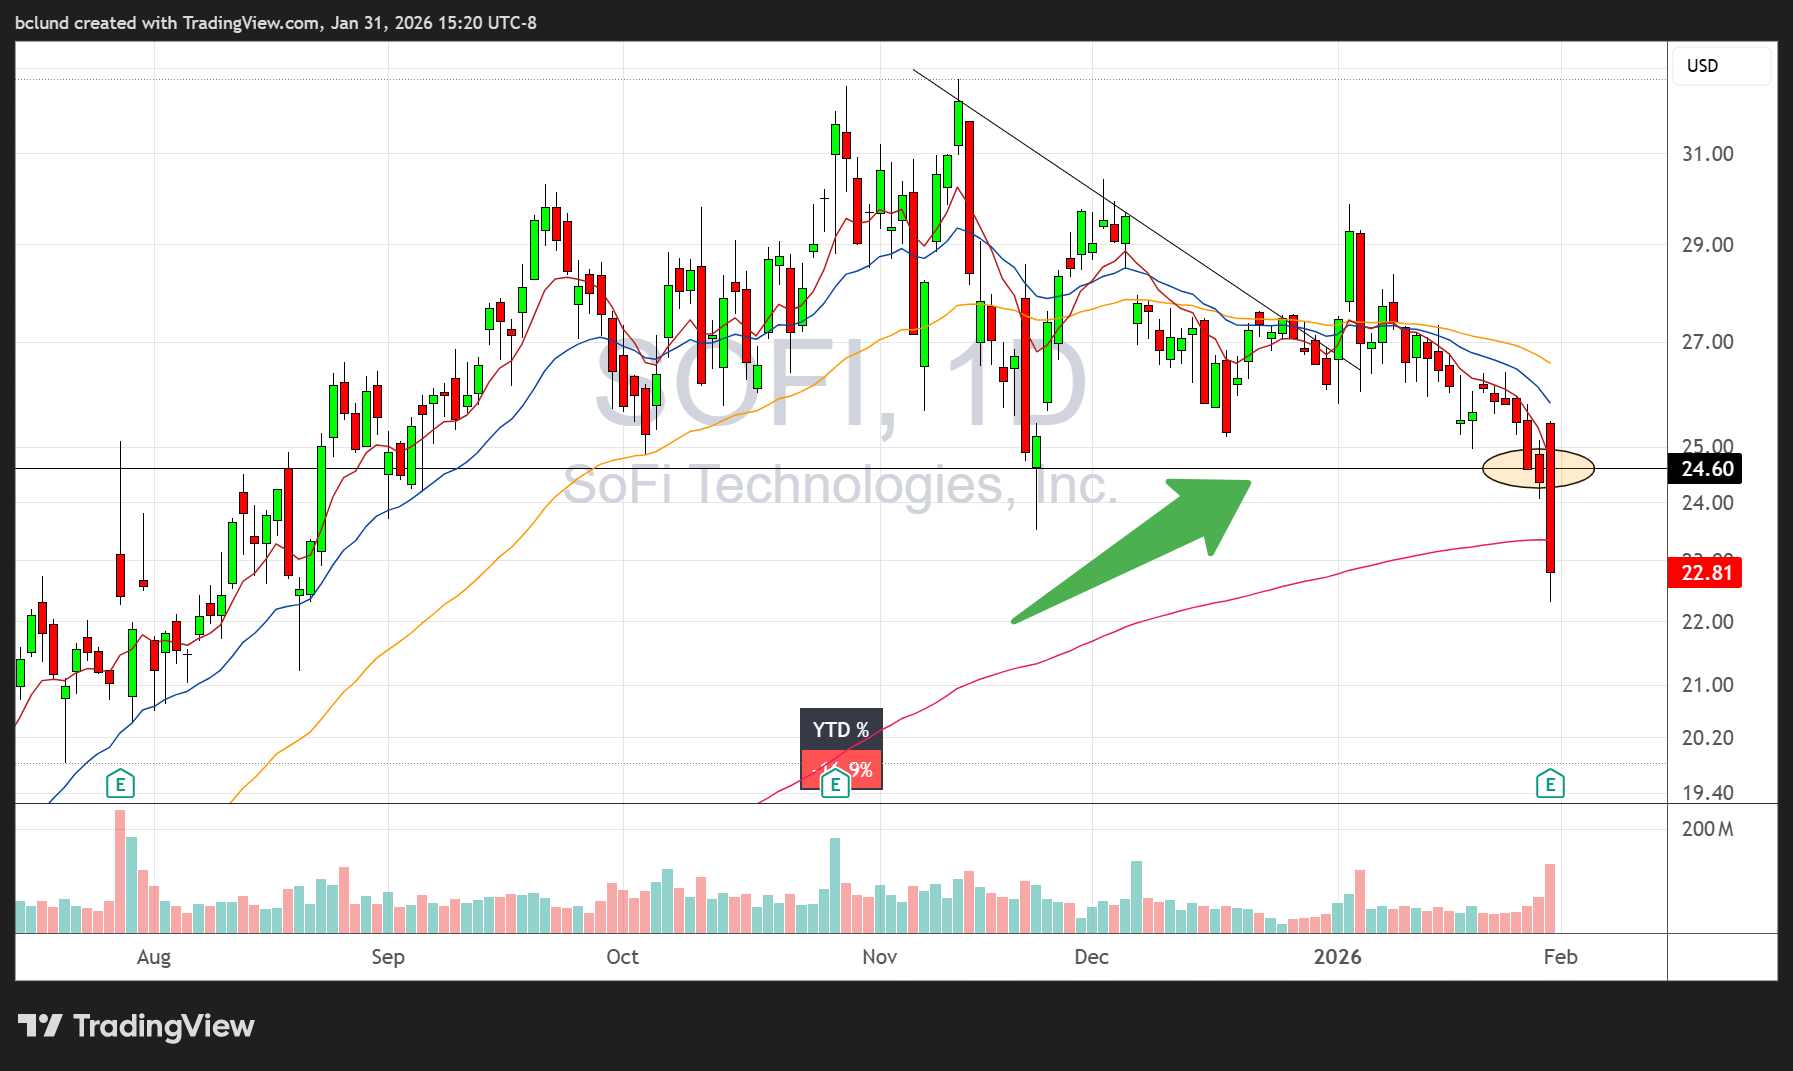
SOFI 0.00%↑ broke both support and the 200EMA in a single day. Often, when you “stretch the rubber band” this fast, you get an equally fast countertrend move.
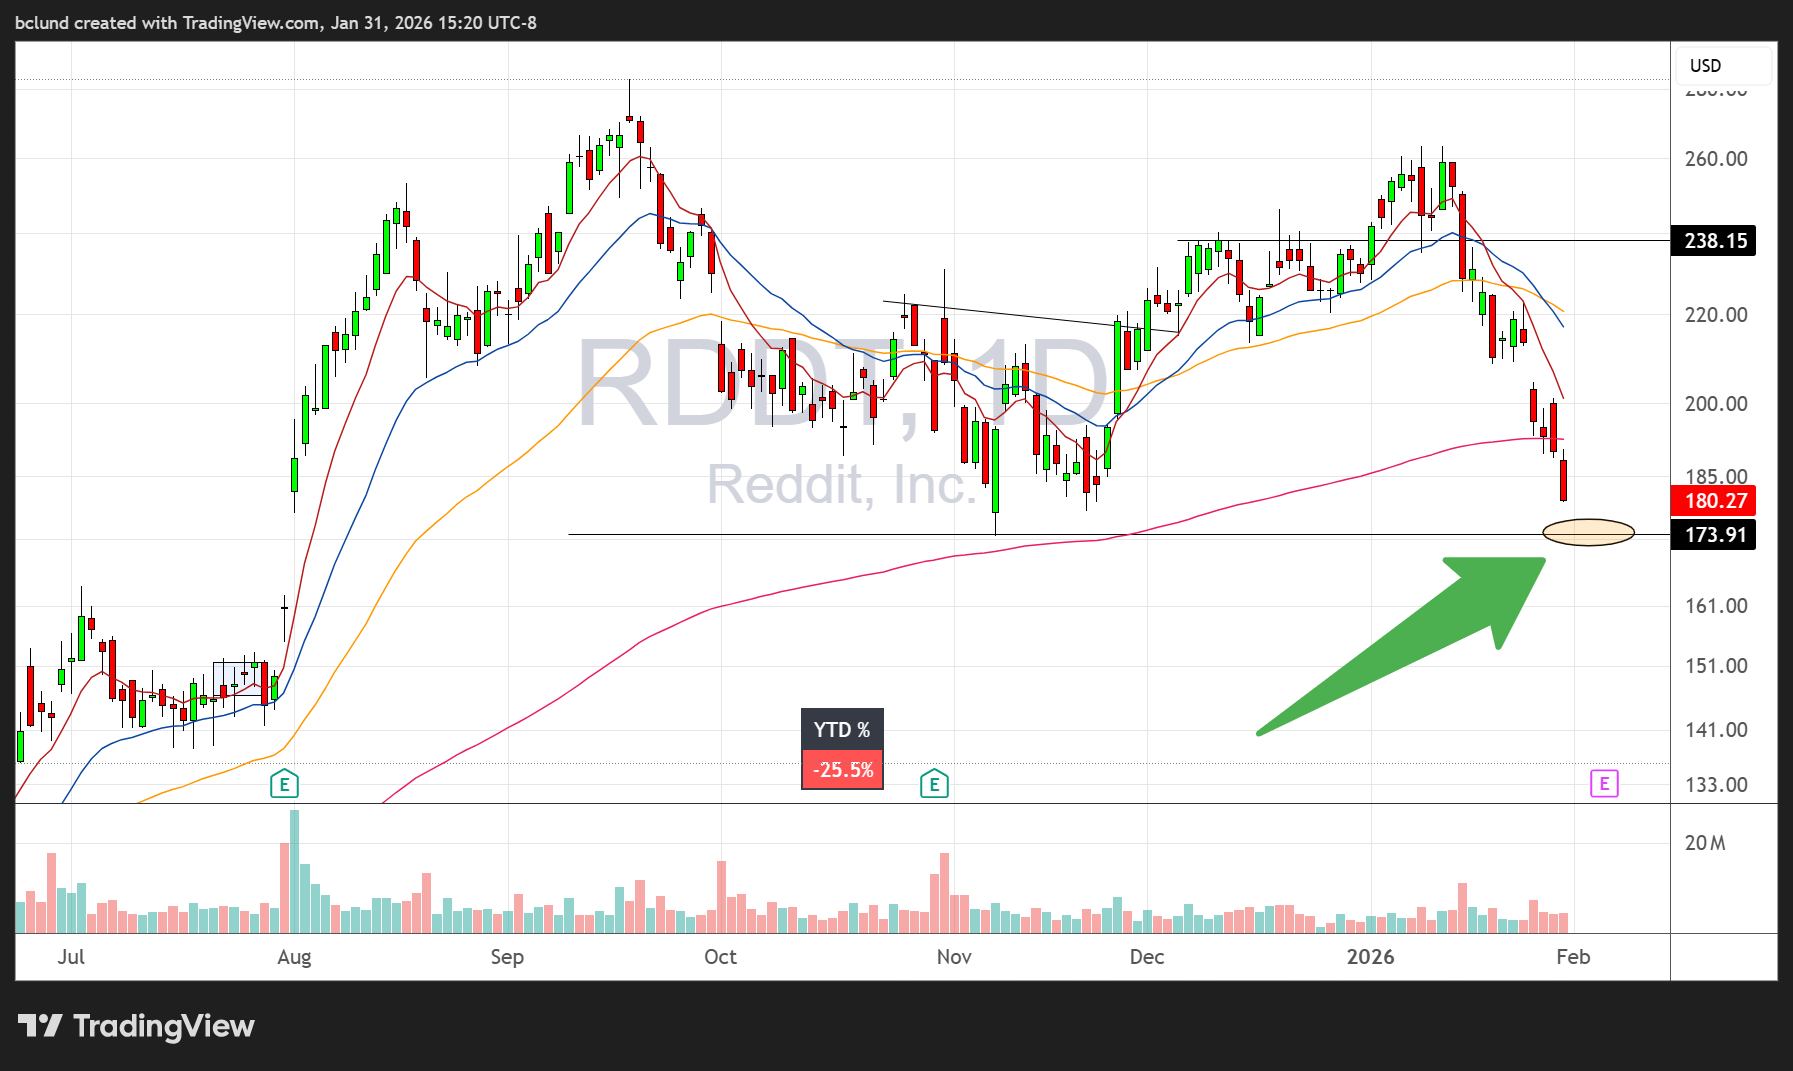
RDDT 0.00%↑ bounced off the 200EMA last week, then plunged back below it. An opening gap down into support around $174 would be a good spot to watch for a reversal.
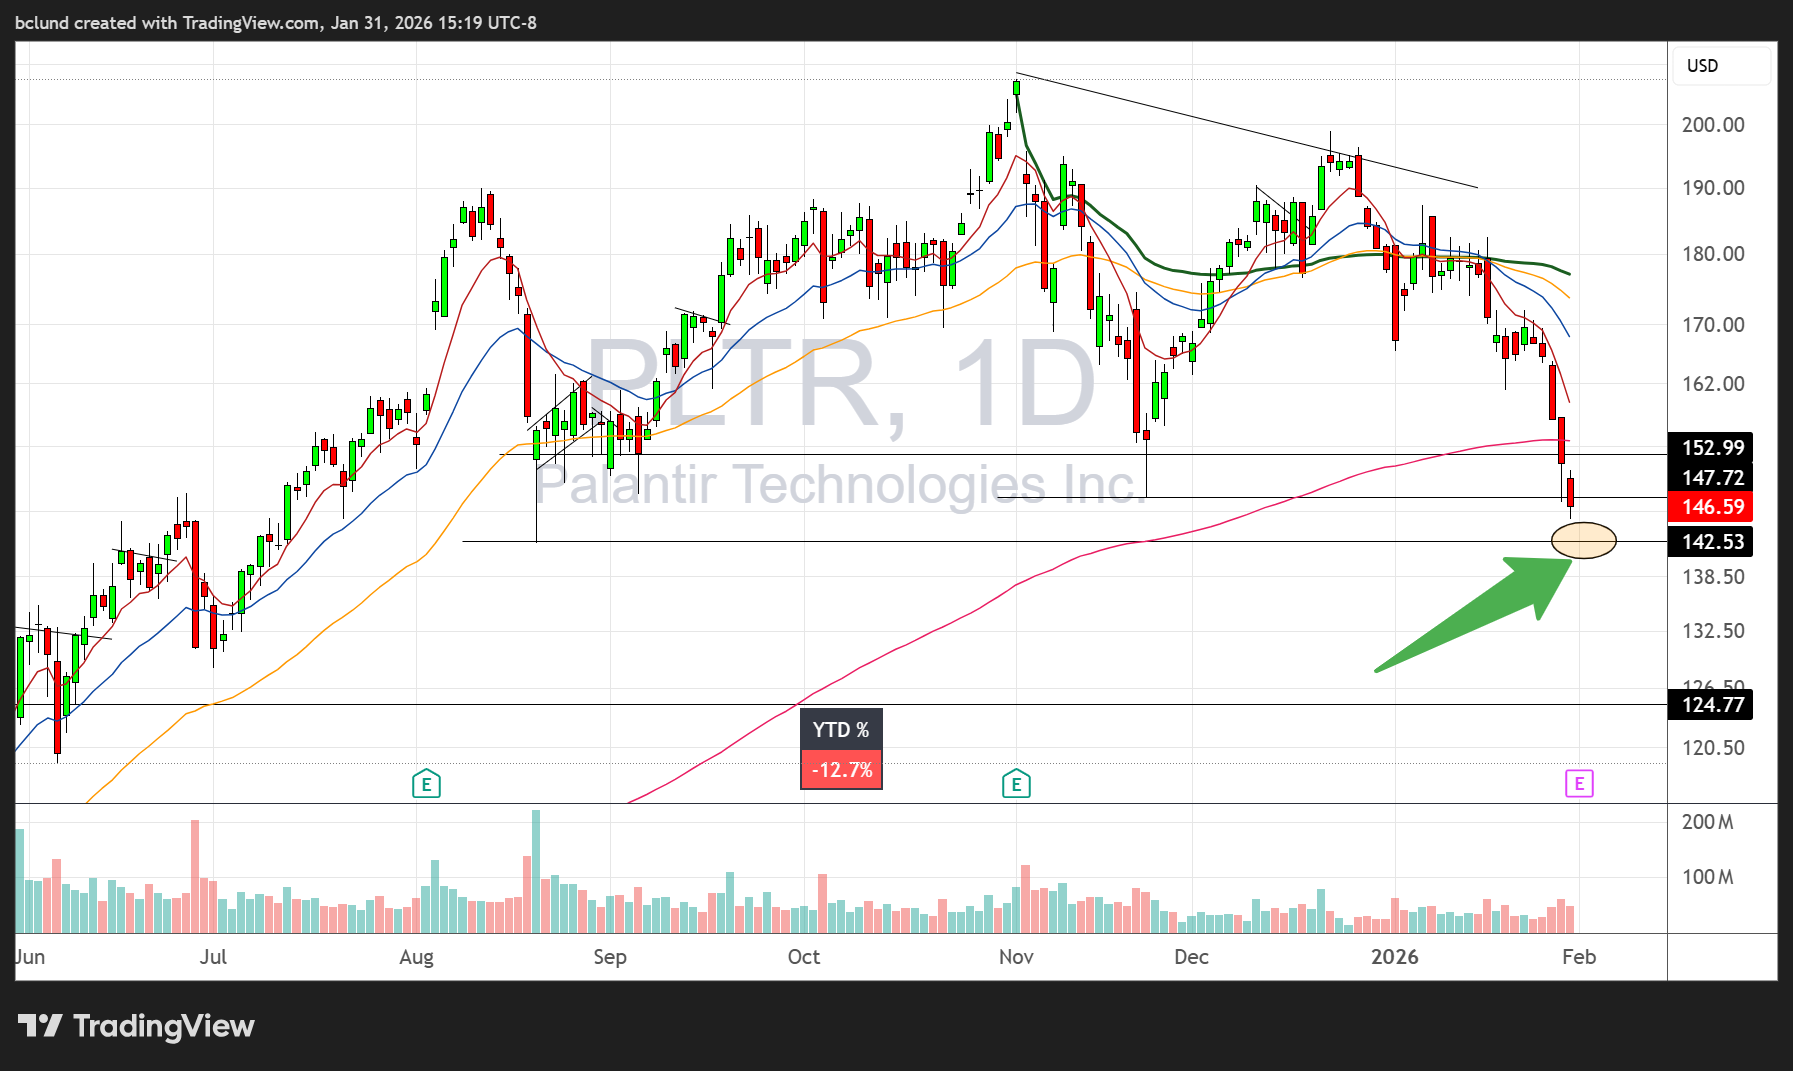
PLTR 0.00%↑ hasn’t just sliced through the 200EMA—it’s also broken two successive support levels. A gap-down open into the next support level at $142.50 would be a spot to watch for a reversal.
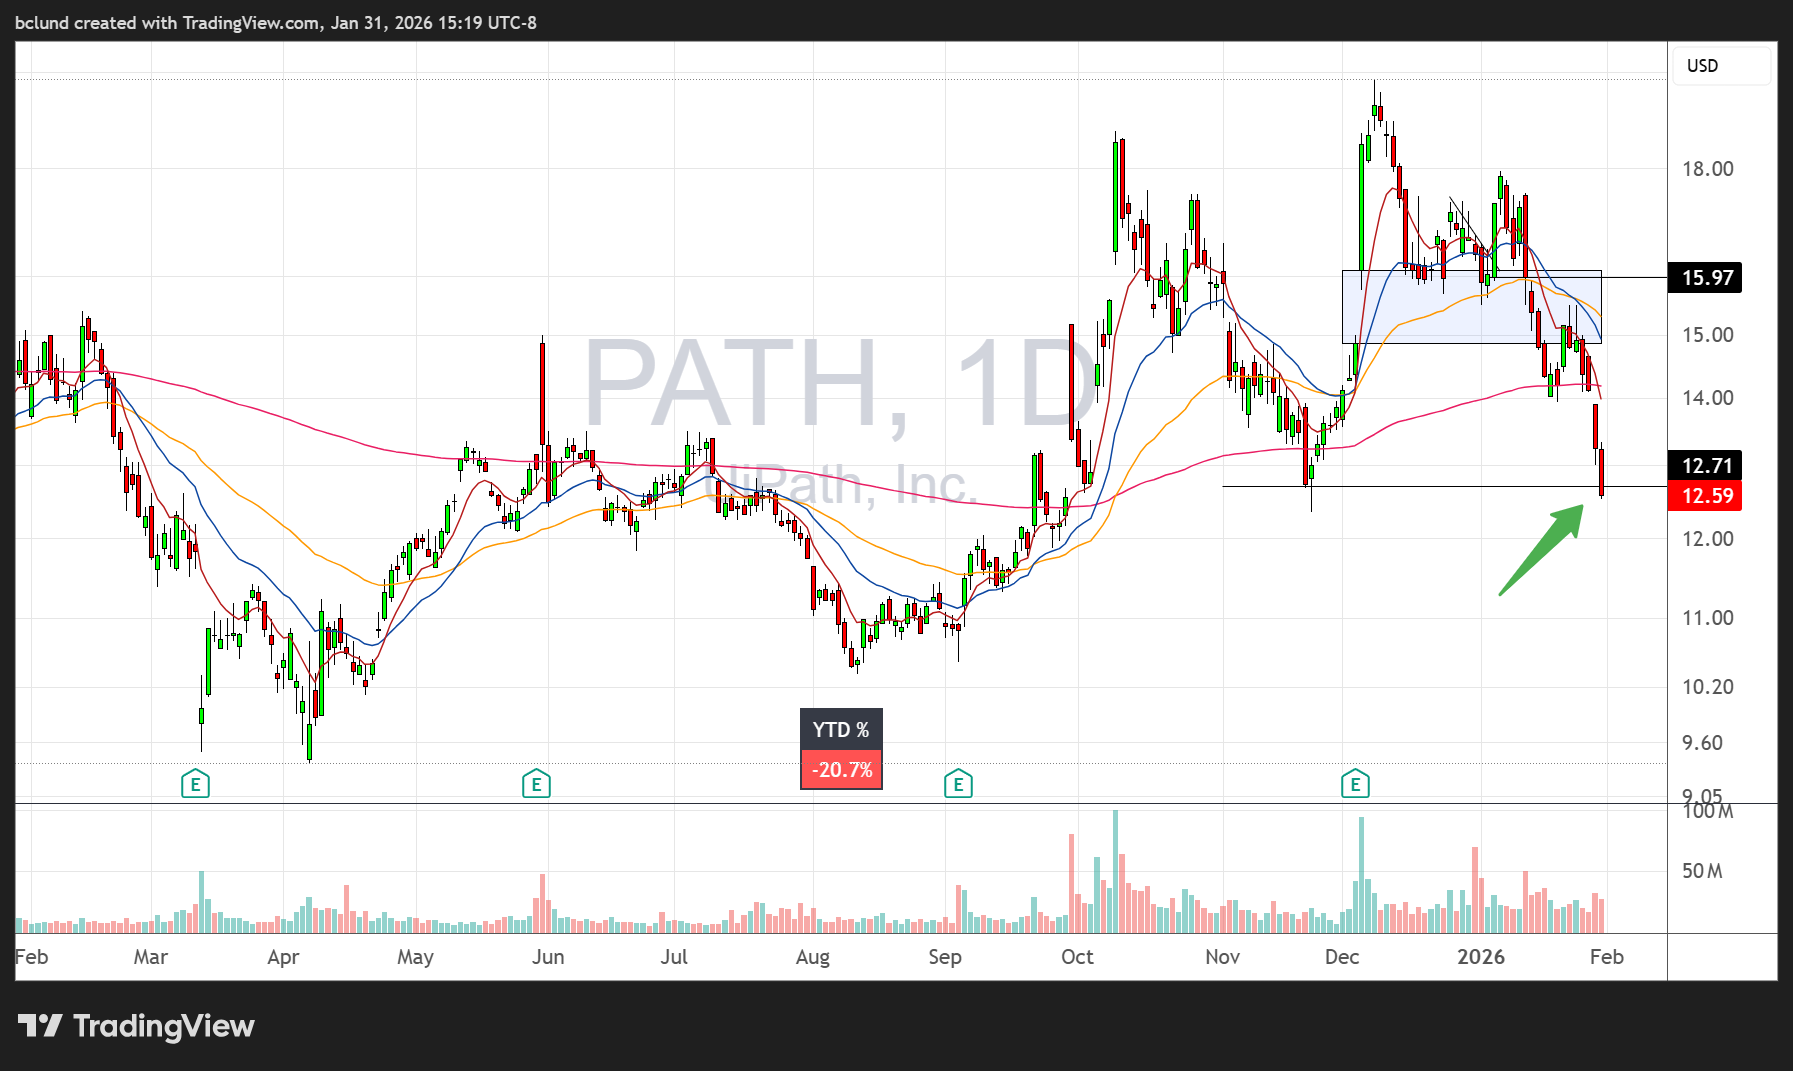
Of these five, PATH 0.00%↑ is the most extended below the 200EMA, closing right on support Friday—a place where a reversal could start.
It should go without saying - but I’ll say it anyway - all opinions expressed in The Lund Loop are my own personal opinions and don’t reflect the views of my employer, any associated entities, or other organizations I’m associated with.
Nothing written, expressed, or implied here should be looked at as investment advice or an admonition to buy, sell, or trade any security or financial instrument. As always, do your own diligence.