If you are not in the Lund Loop Discord you’re missing out. Subscribe today to become part of this exclusive trading and investing community.
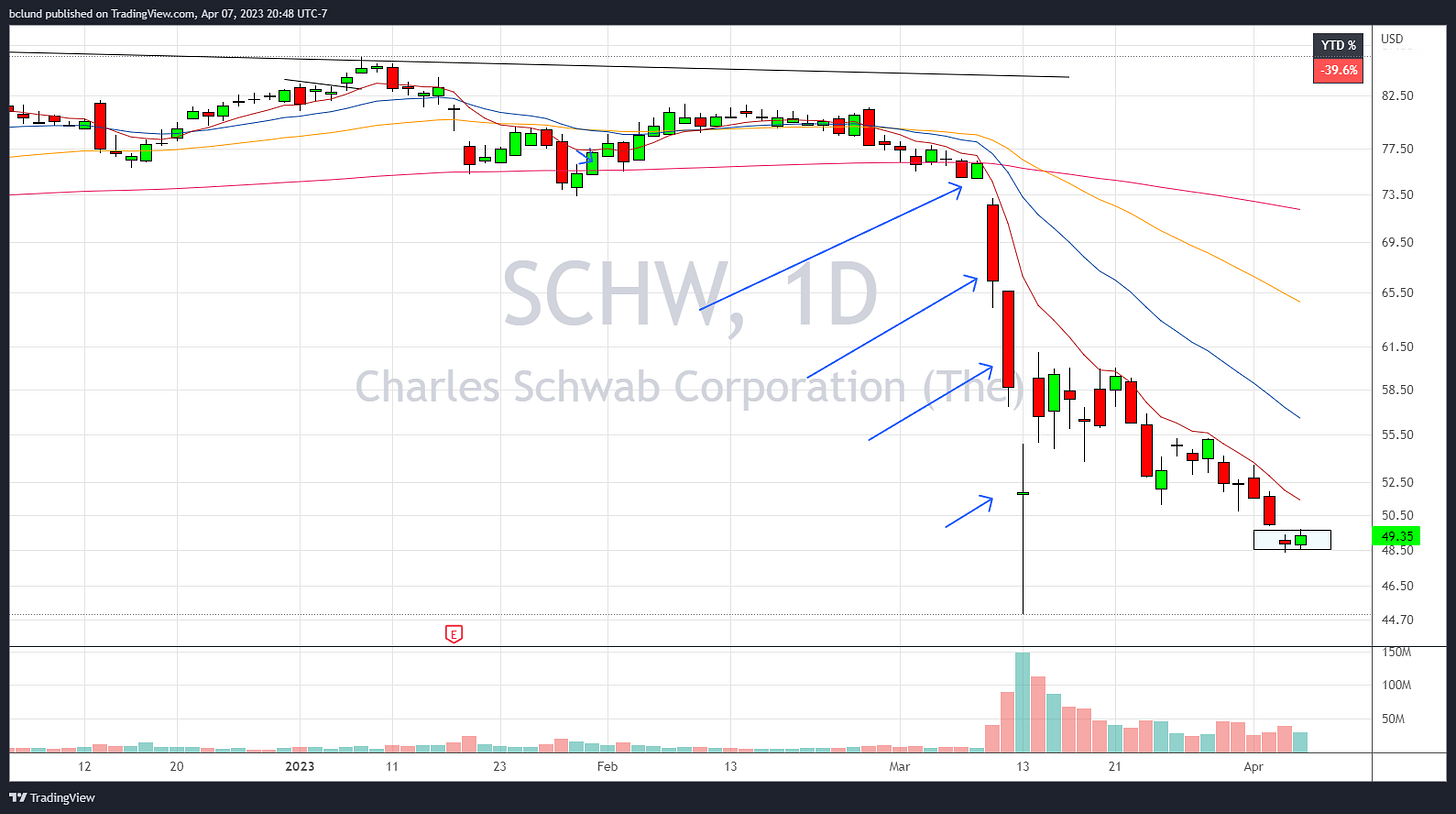
If we look at the attached daily chart of Charles Schwab (SCHW), we see a slow-motion train wreck in progress.
And there’s a fierce debate raging across the internets about this current price action.
-Is this an overreaction, with Schwab getting caught up in the recent weakness in the banking sector?
-Or is there another shoe left to drop, one that the crashing price is telegraphing?
The bulls rally cry is, “Schwab is not going anywhere,” and I would agree with that. Schwab, the company is not going anywhere.
But a company is not the same as its stock.
And that’s why timeframes are so important in your decision-making process.
If you are a long-term investor with a time horizon measured in years or decades, investing based upon the concept of “Schwab is not going anywhere,” is reasonable.
But if you are a trader or active investor looking for short-term moves, “Schwab is not going anywhere,” is a recipe for losing a lot of money – fast.
Just look at the zoomed in version of the daily chart above.
You would have been correct in saying, “Schwab is not going anywhere,” on March 8th (blue arrow), yet the next day the stock was down 13%.
And the day after that it was down another 12%.
The day after, another 12% lower.
Currently, the stock is down 40% on the year and 51% from its all-time highs, and Schwab (the company) is still not going anywhere.
The takeaway here is, know your investing/trading timeframes.
Because the right analysis in the wrong frame can be disastrous to your P&L.
Alright, let’s get to this week’s charts…
Chart Spotlight
Each week I choose 5 compelling setups to spotlight.
To see all the charts on the Lund Loop watchlists, check out the ‘Charts in Focus’ post below, and for full analysis, watch the the ‘Market Strategy’ video below
Click any chart to enlarge.
Please read the disclosures at the bottom of the page.


