

One of the ways I gauge the overall health of the market is by watching how stocks flow in and out of my watchlists.
Each week I scroll through a ridiculously large amount of charts, culling and curating them, and placing the lucky winners onto either my red, green, or orange watchlists.
Red watchlist: Stocks that are exhibiting interesting price/volume behavior that I need to monitor more closely.
Green Watchlist: Stocks that are set up and ready to trigger on the daily chart.
Orange watchlist: Stocks that have already triggered and are now in an “active sequence.”
In a healthy market stocks flow; from red to green to orange and back to green as they pause, setup, and breakout again, moving back to orange when they do.
When these watchlists are overflowing with stocks it’s usually a good sign that there’s too much froth in the market, at least in the short term, and we’re likely due for a correction, or at least a pullback.
When the lists are barren, it’s often a choppy, trendless market, or one that’s about to roll over.
After the market had that ugly gap down day on February 21st, not surprisingly, my watchlists thinned out rather dramatically - but, not completely.
What was surprising was that as we went on to form what I jokingly referred to as a “Bullish Cyclone Star” pattern over the the next four days, not only did the stragglers hang on, but a few new stocks came onto the watchlists.

And they hung on, and hung on, even as we tested the lower range of that completely made up pattern. Don’t get me wrong, they weren’t triggering, but they also weren’t going away.
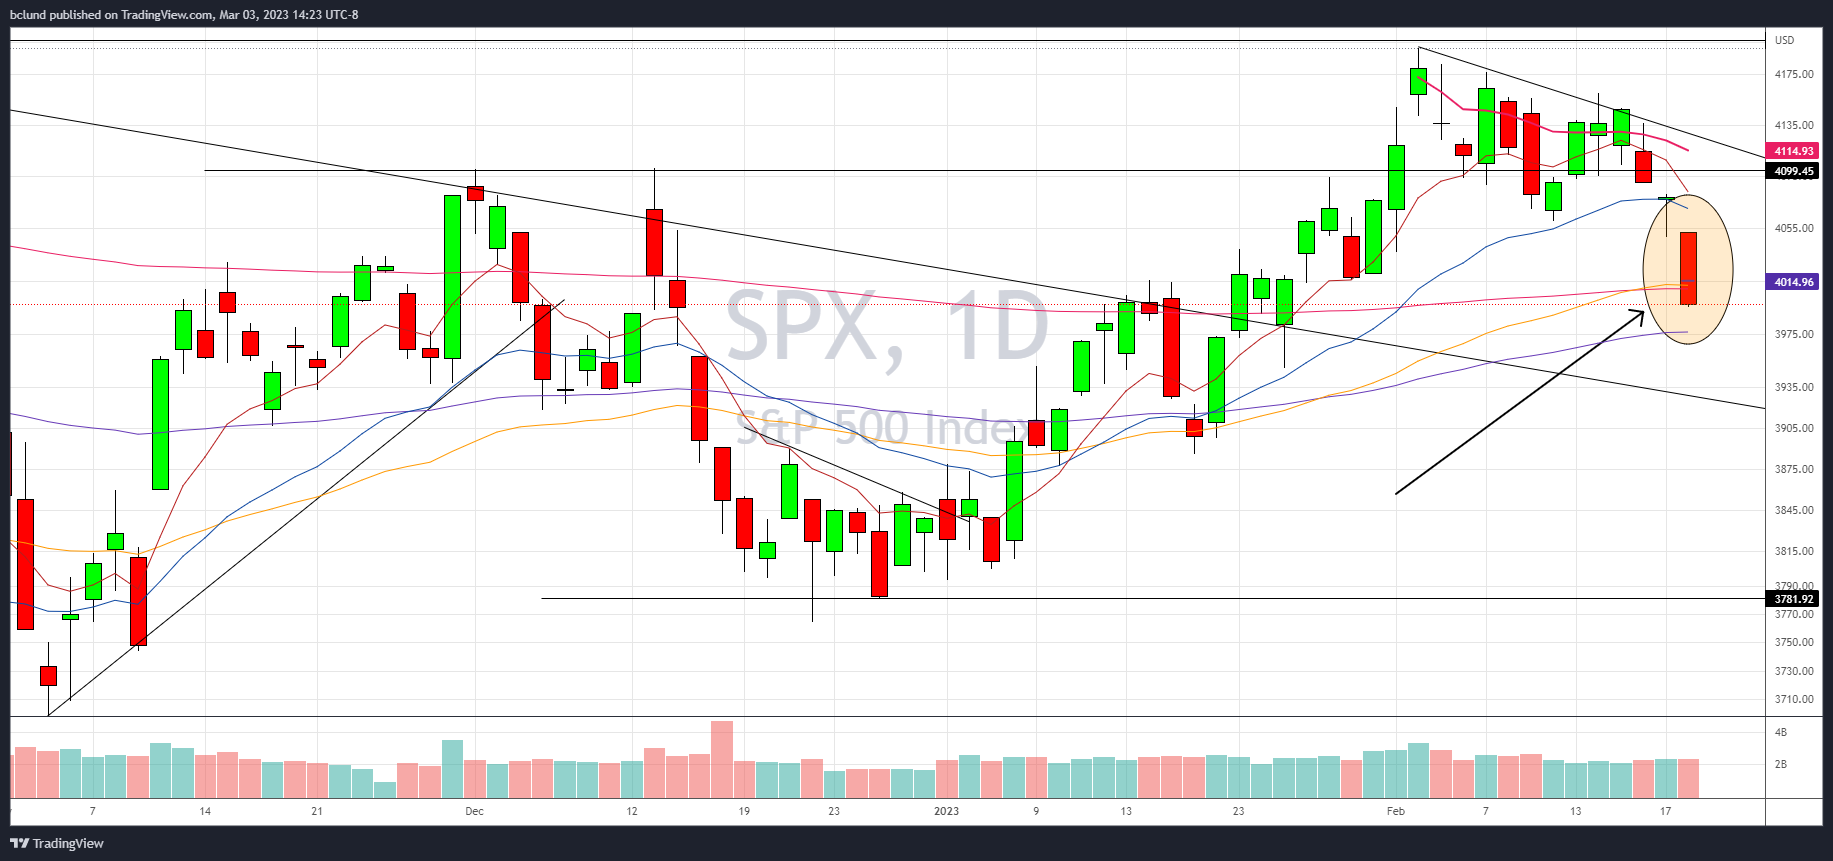
The open this past Thursday was ugly, and it looked like we were getting reading to start another leg down, then everything changed.

We recaptured the previous day’s low, based sideways for 3.5 hours, then broke out, riding the 5/9EMA right up to the previous day’s high where we based again, before breaking out (again) and finishing not far off the high of the day.
As all this was taking place you could watch in real-time as the stalwarts on the watchlists, the best of breed, the relative strength champs, reversed intraday and elegantly floated to the top of the daily winners list like so much delicious profitable cream.
To torture this dairy-based metaphor a slight bit more, that follow through on Friday was the icing on the cake.
So the market now finds itself in a decidedly better place than it was 48-hours ago.
Too be clear, we’re not out of the “Oh shit, are we going back to the lows” woods yet, but but those watchlists are looking much better than they were.
Chart Spotlight
Each week I choose 5 compelling setups to spotlight.
To see all the charts of the watchlists, check out the ‘Charts in Focus’ post below, and for full analysis, watch the the ‘Market Strategy’ video below
Click any chart to enlarge.
Please read the disclosures at the bottom of the page.
The first five of the seven charts below have similar setups; they each had massive gap ups on earnings and have pulled back aggressively since.
The working thesis is that these pullbacks may be overdone and we’re looking for candles we can key off of if the stock “snaps back” in the direction of the previous trend.
Most likely these trades will only work of the overall market “snaps back” as well. Without that, these are low-level conviction setups at best.
As always, never chase a gap up or ignore a gap down.
For more info on how to play these setups, watch this video: How to Trade Triggers Off the Green Watchlist.
Okay, let’s get to the charts.