The Science of Self-Deception
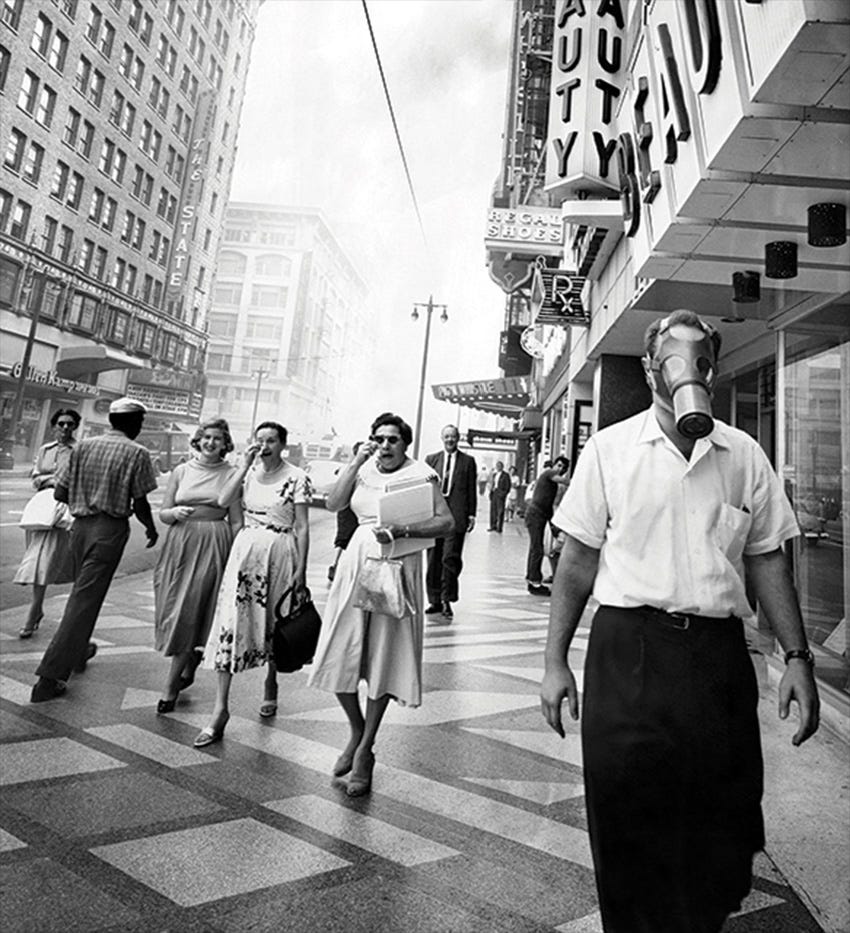
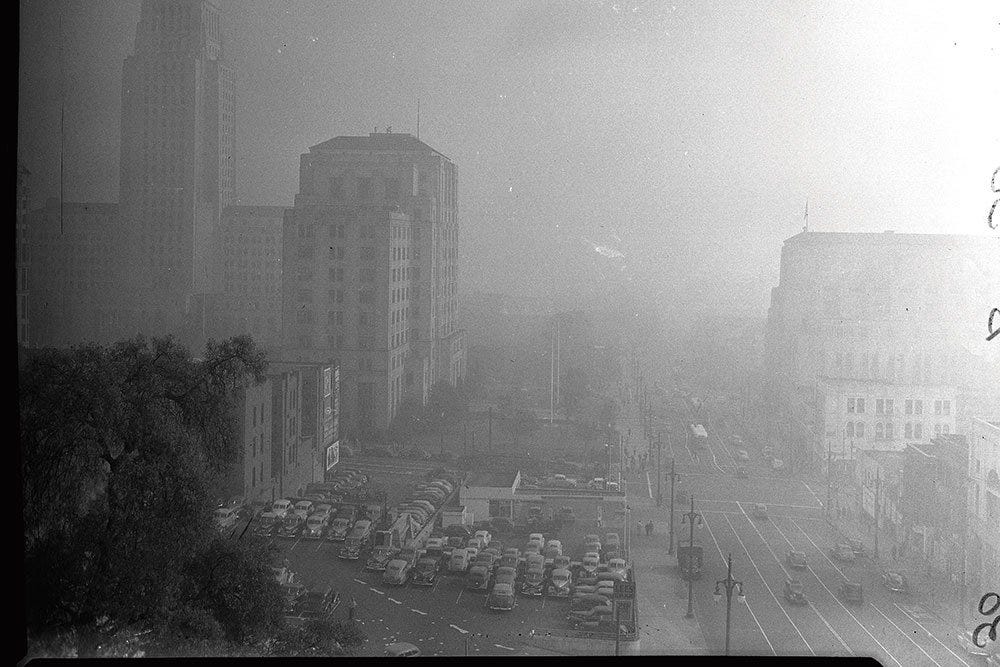
On July 26th, 1943, the residents of Los Angles, California awoke to find that the City of Angles was in the midst of a gas attack.
As a smoky haze enveloped the city, visibility was cut down to less than three blocks and cars swerved through the soup. Soon citizens began to complain of burning eyes, runny noses, nausea, headaches, and a stinging sensation in the lungs.
In the midst of World War II, people thought, not unreasonably, that the city was under enemy attack. But as residents soon found out, the attack wasn’t from the outside but from within.
Described by government officials at the time as a “hellish cloud that smelled of bleach,” this phenomenon didn’t yet have a name. During its regular appearance in the ensuing years, the Los Angeles Times simply referred to it as “daylight dim out.”
We know it today as the portmanteau coined in 1905 by Dr. Henry Antoine Des Voeux in his paper, “Fog and Smoke.”
Smog.
The population boom that hit Los Angeles beginning at the turn of the century brought with it an increase in factories and automobiles whose smoke and exhaust combined with the geography to trap this toxic smog over the Southland.
But there were other culprits.
In 1947, Los Angeles had more than 300,000 backyard incinerators, used by residents to dispose of their trash, and burning garbage in city dumps was common practice. Citrus growers operated more than 1 million smudge pots that burned motor oil, old tires, and other types of waste to prevent frost damage to crops.
The ash and soot from these and other sources was so thick that freshly laundered clothing hung outside became soiled before they dried. And on cold winter’s days, when atmospheric inversions trapped pollutants low to the ground, blowing your nose produced a mess of black mucus.

The smog was so bad - and persistent - that the California State Assembly created the first government agency dedicated to improving air quality, the Los Angeles County Air Pollution Control District.
In the ensuing decades, this agency and its successors waged a relentless war on air pollution.
They passed new and tough regulations on factory and refinery emissions.
They mandated fuel pump nozzles at service stations designed to capture the 120,000 gallons of gasoline that were evaporating daily.
They outlawed trash burning, backyard incinerators, smudge pots and a whole host of other ecologically damaging practices.
By 1953, the initiatives put in place by the Los Angeles APCD were eliminating 460 tons of smog forming emissions per day.
These initiatives began to be adopted by other city and county agencies statewide, culminating in the landmark regulation passed in 1975 that required every car sold in California be outfitted with a catalytic converter, an emission control device designed to make exhaust gases and pollutants less toxic.
Yet, despite decades of aggressive regulations and enforcement, by 1997 there had been little or no progress in improving the air quality in Los Angeles.
How can that be?
Even the Air Quality Management District, the successor agency to the Los Angeles APCD, thought they were on the right track, as reported in their 1996 annual report.
“Clean air is within sight. Stage 1 smog episodes have plummeted from 121 in 1977 to just seven in 1996, and are projected to vanish entirely by 1999.”
So what happened?
Science can be described as the systematic study of the structure and behavior of the physical and natural world through observation, experimentation, and the testing of theories against evidence.
And data is evidence. It’s what “settles” the science.
Or so you would think.
If you peruse the historical data tables at AQMD.gov - no worries, I did it for you - you will notice that there was an almost 300% increase in Stage 1 smog episodes in 1997.
What could account for such a staggering increase in harmful air quality, in such a short span of time, especially given that no regulations, rules, or laws were repealed or removed?
They reorganized the data.
In 1996, a Stage 1 smog episode was defined as a measurement of particulates greater than 0.12 parts per million (ppm), but in 1997 that number was lowered by 33% to 0.08 ppm.
Despite the change, air quality began to improve, until 2008, when Stage 1 episodes jumped 50% over the previous year.
Yes, you guessed it. The ppm threshold was lowered to 0.075.
And still, the air quality improved, until 2015 when episodes jumped 60% - after the ppm threshold was dropped to 0.070.
Think of how much focus there has been on environmental causes since 2015.
Think about the push, especially in states like California, for ESG investing and green initiatives.
Think about all the environmentally friendly technologies that have become part of our lives since then - like electric cars.
Surely, by 2022, the air quality in Los Angeles must have been better than ever?
Not according to the American Lung Association, who in a recent report not only said that Los Angeles has the worst air quality in the United States, but that it has gotten worse since 2010.
How can that be?
Simple. They decided to throw out the AQMD’s ppm threshold from 2015 - you know, the one revised down from 2008 and 1997 - in favor of their own proprietary criteria.
After all, who would click on the headline, “Los Angeles’s Air Quality Is The Best In 100 Years.”
In reading Brian Shannon’s great new book, Maximum Trading Gains With Anchored VWAP, I came upon a line that seems deceptively obvious at first.
“Time is how we organize market data, and it becomes the most subjective component when you decide to anchor your VWAP starting point.”
But at it’s essence it’s a truly profound statement: We subjectively organize market data by time.
When we embark upon an a trade, we have to take all the data, all the inputs, all the noise that the market produces every moment of every day and make sense of it.
We do that on charts with timeframes, with moving averages by length, and with studies and drawings using data points - all of which we choose of our own volition.
That’s the easy part. The hard part comes later, when a decision needs to be made, particularly when our original thesis - and money - is at risk.
That’s when we have a choice. Do we respect the data we chose, even though it now threatens our thesis, or do we change it so we can keep our beliefs alive?
Like changing timeframes from an intraday chart to a daily chart?
Or switching from the 21-day moving average to the 50-day?
Or maybe sliding that anchor point on the VWAP to something that avoids having to realize a loss - for now.
It’s tempting to reorganize the data. To perpetrate the deception.
We expect governments, institutions, the media, and others with vested interests to do it.
It just sucks when we do it to ourselves.
The Lund Loop is about the intersection of markets, trading, and as you just saw, life - but it’s more than that.
It’s a community of traders and active investors who are committed to helping everyone crush the markets. Basically, we’re the anti-FinTwit.
If you’d like to take advantage of everything the Lund Loop has to offer, consider becoming a paid subscriber.


